Volume 21, Chapter 2
Building KPIs and Dashboards
Definition
An early attempt at a dashboard for MANIAC MINDZ tried to track nearly everything measurable at once, fifty-plus numbers on a single sheet, updated weekly. In practice, almost nobody actually reviewed it in full, and not a single number on it had a clearly named owner responsible for acting when it moved.
A KPI (Key Performance Indicator) is a number or checkable fact used to measure whether a role or system is succeeding, never an opinion. A dashboard is a small, carefully chosen set of KPIs assembled into one view, so the business's health can be checked at a glance instead of hunting through separate reports.
Why did fifty tracked numbers end up less useful than a handful would have been? Because attention is limited, and a sheet with fifty numbers spreads that attention so thin that nobody genuinely reviews any single one of them. A dashboard's job isn't to capture everything, it's to capture the few numbers someone will actually look at and act on.
A good KPI passes four tests: it's specific, it's tied to a real decision, someone specific owns it, and it's reviewed on a set rhythm. A dashboard is simply a handful of good KPIs, from across Chapter 1, Section 4's Reports Module, gathered where they can actually be seen together.
What Makes a KPI Good
Specific
"2 unresolved complaints per month," not "good service." See Volume 06's KPI test.
Tied to a real decision
Reviewing it should be able to change what happens next.
Owned by someone specific
A KPI with no owner is nobody's job to act on.
Reviewed on a set rhythm
Per Chapter 3, not "whenever someone remembers."
A KPI with no owner and no review date is just a number floating in a spreadsheet. It needs someone whose job it is to look at it and act.
Building a Dashboard
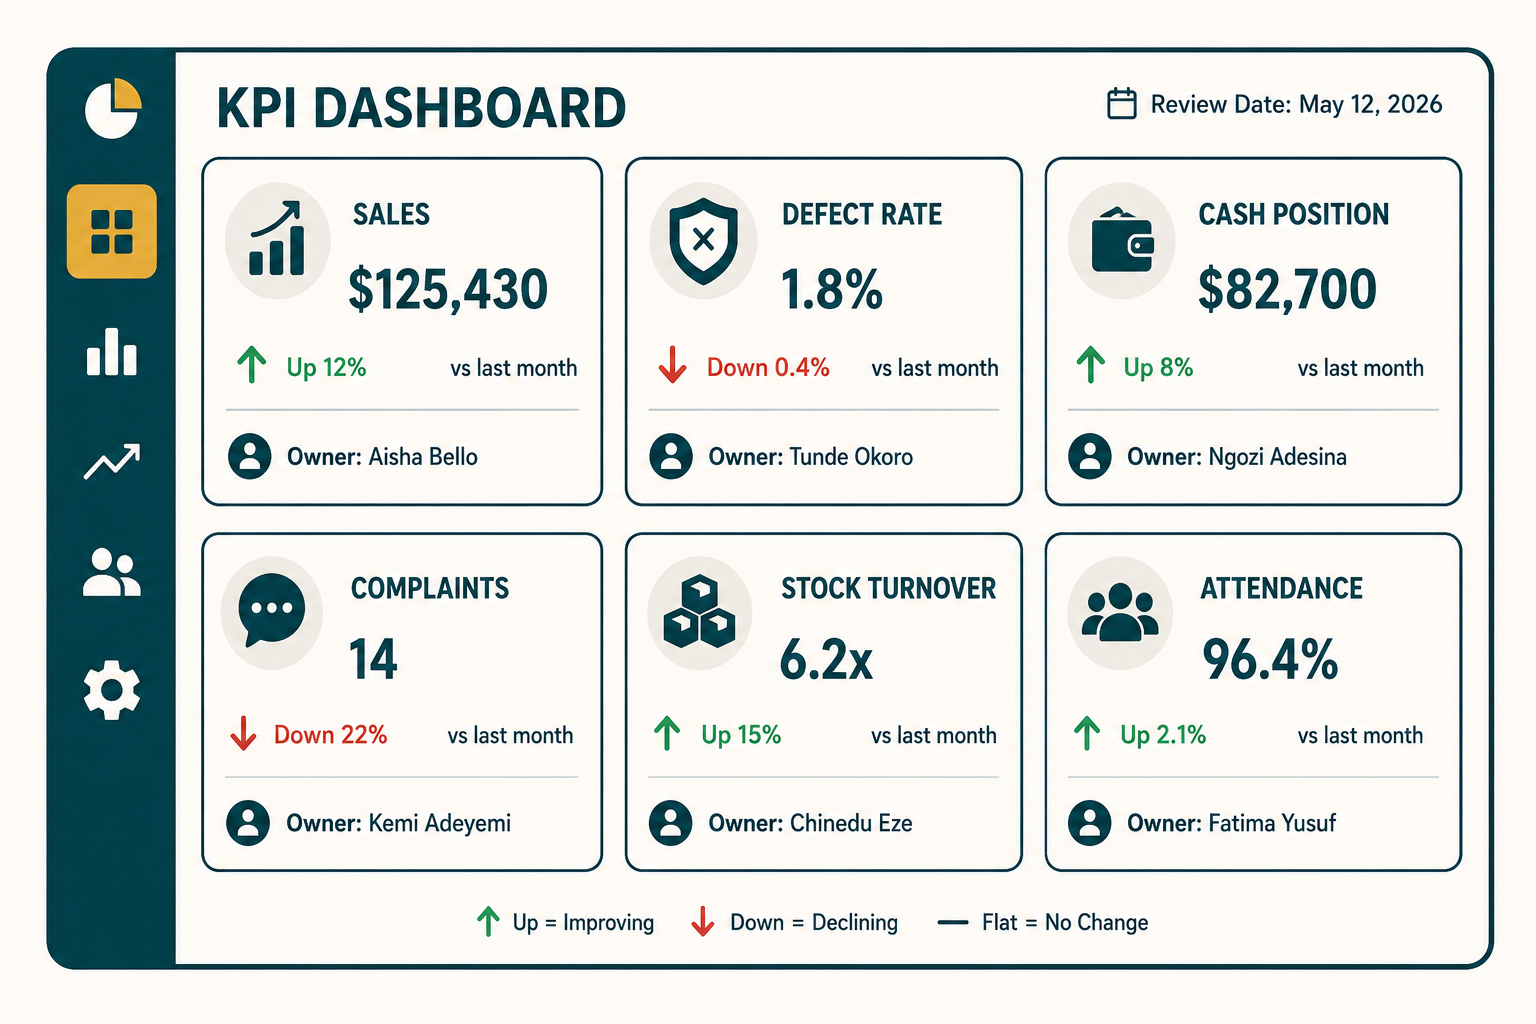
A dashboard pulls a handful of the business's most important KPIs, usually one or two per major area (sales, quality, cash, customers, inventory, people), into a single view, each with its current value, its trend, and its named owner.
More isn't better. A dashboard crowded with twenty numbers gets skimmed and ignored; a dashboard with six owned, reviewed numbers actually gets used. The specific weekly numbers and a ready-to-use template live in Volume 27: Business Metrics & Dashboards, this chapter teaches the core discipline first.
Example Story: The Dashboard With Fifty Numbers
Here's the full version of the fifty-numbers story from the start of this chapter.
An early attempt at a dashboard for MANIAC MINDZ tried to track nearly everything measurable at once, fifty-plus numbers on a single sheet, updated weekly. In practice, almost nobody actually reviewed it in full, and not a single number on it had a clearly named owner responsible for acting when it moved.
More data hadn't meant more insight. It had meant less. Cutting it down to six KPIs, one per major area, each with a named owner and a monthly review slot, turned an ignored spreadsheet into a document the owner actually opened every month, and acted on.
Across Industries
The one number worth putting front and center on a dashboard changes depending on what actually drives each business.
| Business | A Core Dashboard KPI |
|---|---|
| Golden Crust Bakery | Daily waste percentage |
| Rapid Auto Works | Average repair turnaround time |
| Precision Print & Press | Reprint rate |
Common Mistakes
This is the exact failure in the example story: more numbers, less attention per number.
A number nobody is responsible for is a number nobody acts on.
If a number moving wouldn't change what anyone does next, it doesn't belong on the dashboard.
Quiz Yourself
Practice Exercise
Choose one KPI per major area of your business (sales, quality, cash, customers, inventory, people), six numbers total. Name an owner and a review rhythm for each before adding a seventh.
Quick Summary
Quick Summary
- A good KPI is specific, tied to a real decision, owned, and reviewed on a set rhythm.
- A dashboard is a small, carefully chosen set of KPIs, not an exhaustive list of everything measurable.
- Fewer, owned, reviewed numbers beat many ignored ones.